See it in action
See the STS beliefs, components, philosophy, and pedagogy in action.
Highlighting structure and focusing on relationships allows students to engage in their learning.
Context learning

What quantities do we see? How are they interacting with each other and what relationships can be seen here?
Students might say:
I see a 2 for the two cookies; 5 for the 5 chocolate chips on each cookie; 10 for the total number of chips
If each cookie has 5 chocolate chips and there are 2 cookies, that makes a total of 10 chips.
If you had 10 chocolate chips to put on two cookies and you wanted it to be fair, you could put 5 on one and 5 on the other.
If you wanted to decorate two cookies and you wanted there to be 5 chocolate chips on each, you would need 10 chocolate chips.
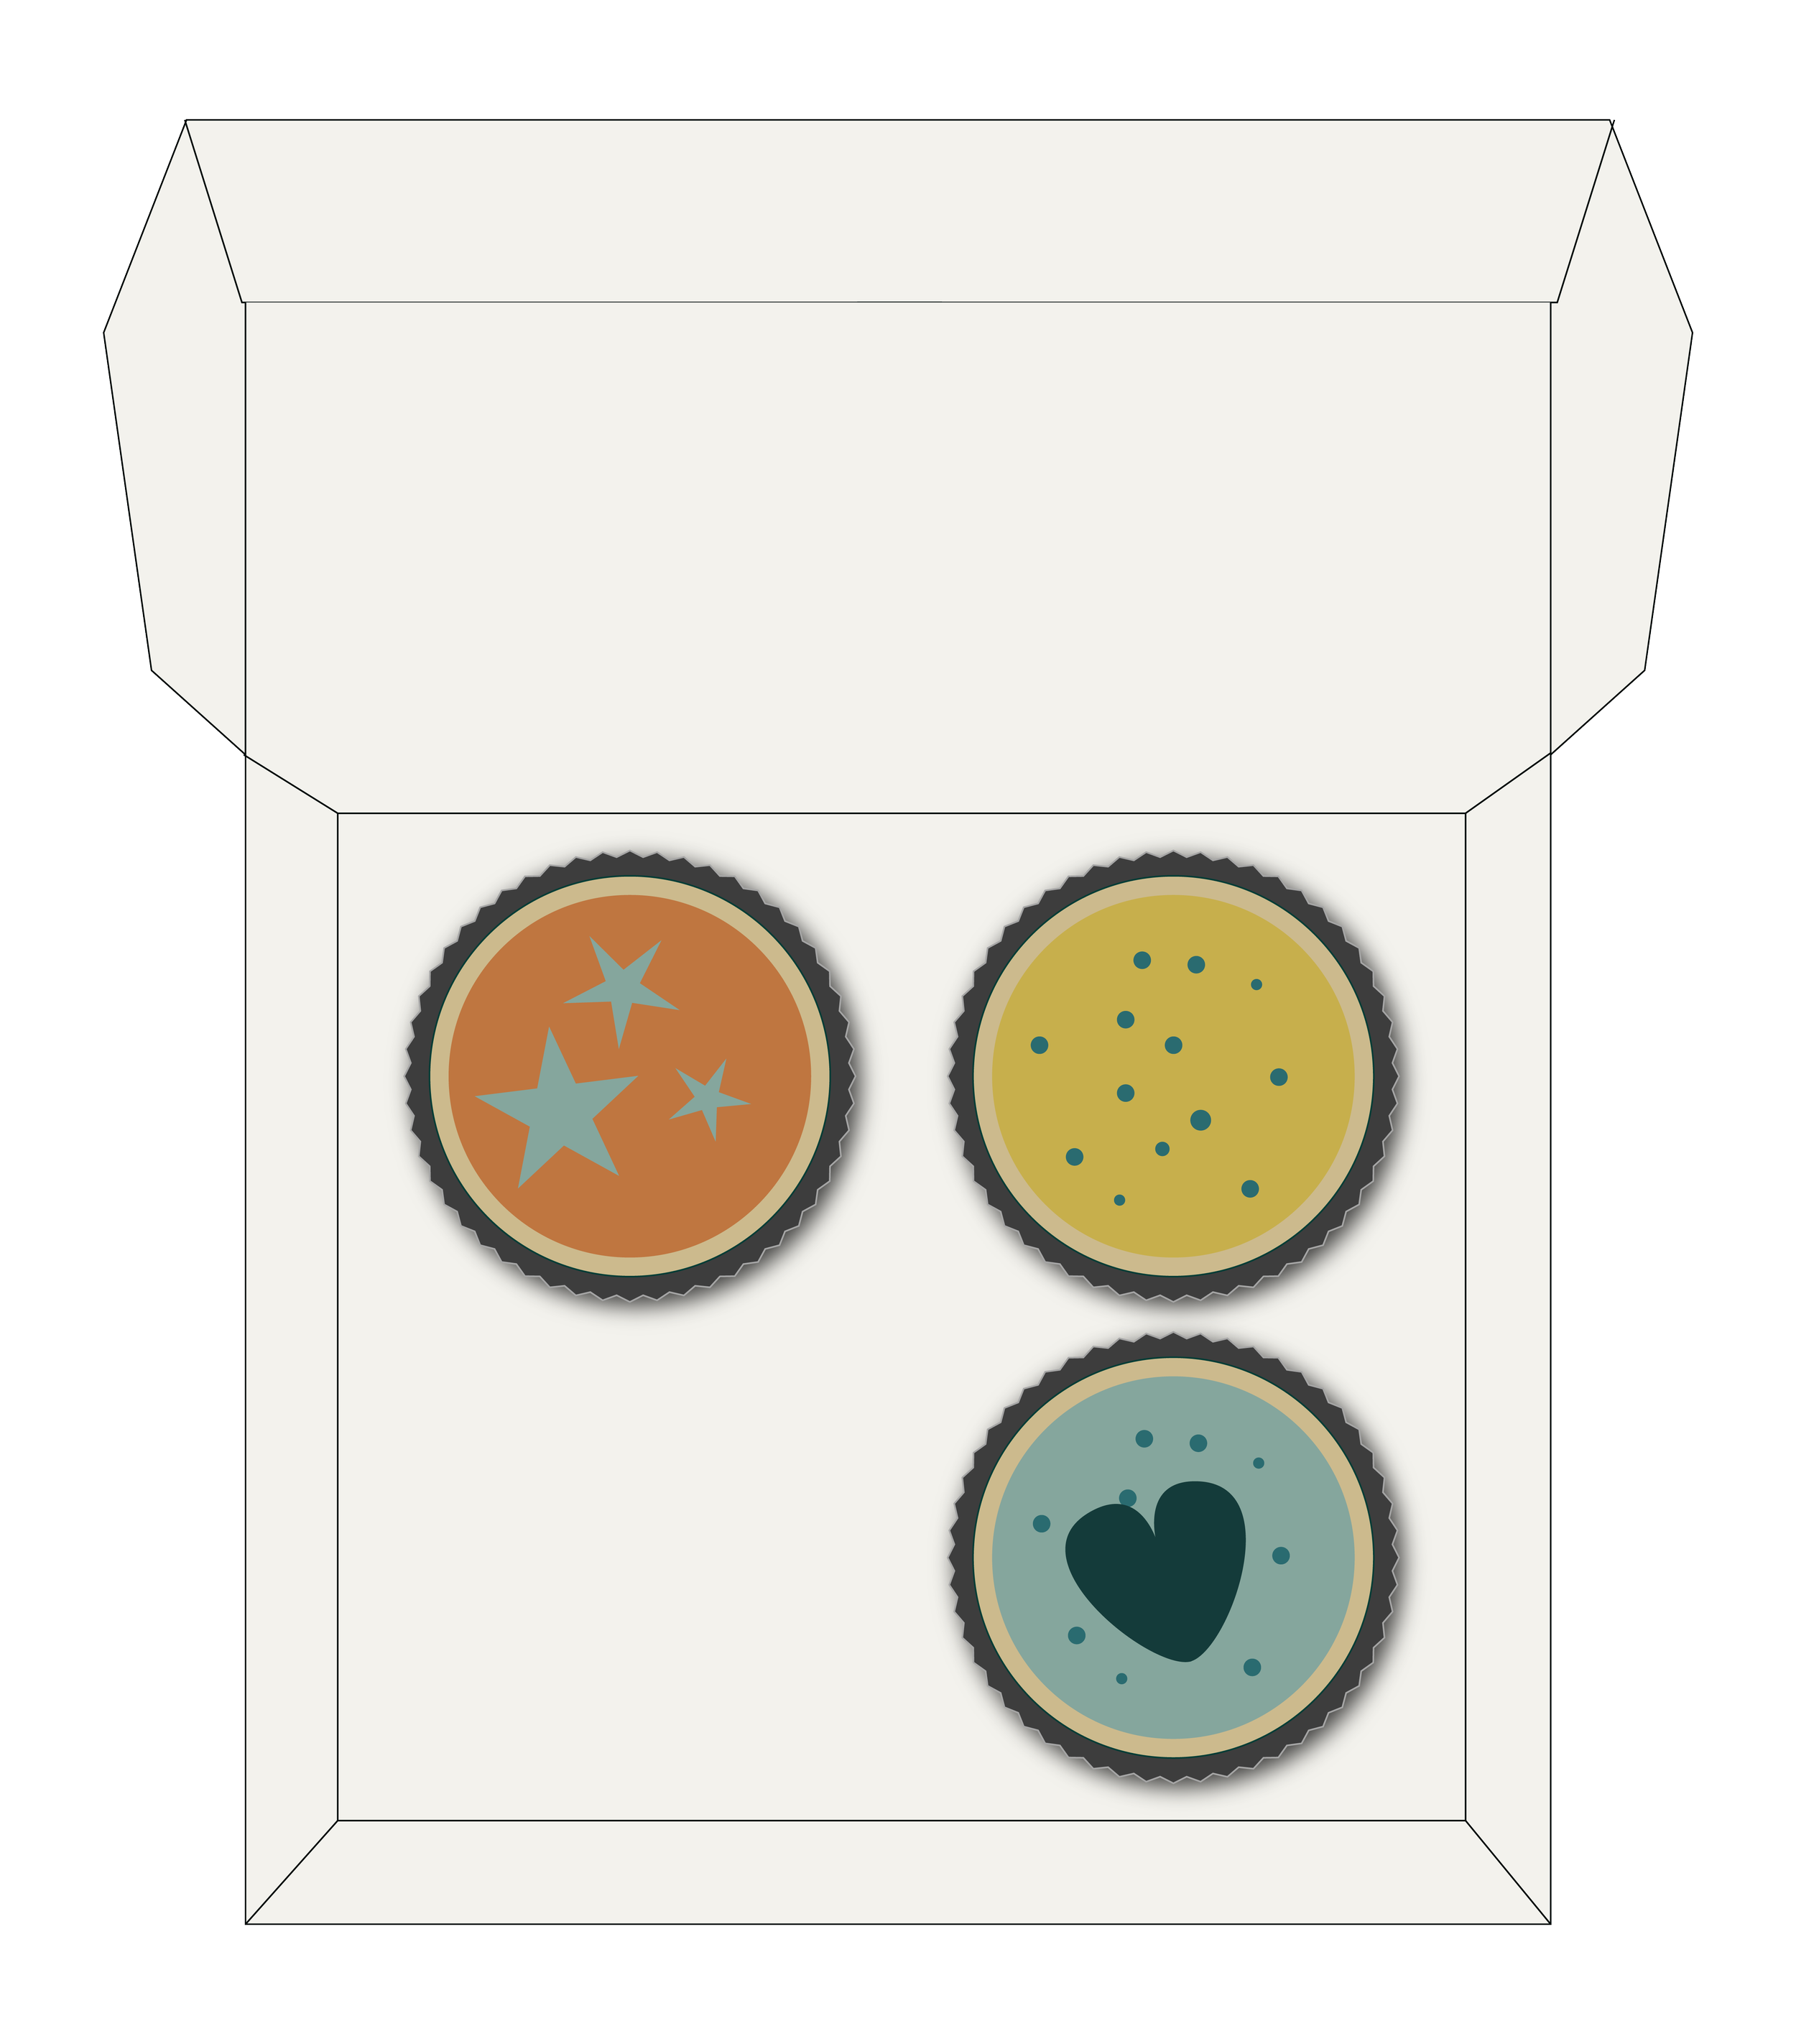
This is a context, this is not operating. The power is simply in noticing the relationships between quantities and highlighting them. This is not just multiplication; this is not division or addition–it is not one thing.
Here, we again see a situation, which could be interpreted in different ways, looking at the relationship between ¾, 4, and 3.
¾ + ¾ + ¾ + ¾ (4 quantities of ¾) = 3 full boxes
4 x ¾ (four quantities of ¾ of a box) = 3 full boxes
¾ x 4 (three-fourths of each of 4 full boxes) = 3
3 ➗3/4 (how many quantities of ¾ of something create 3 wholes) = 4
3 ➗4 (how much of 4 whole boxes fills 3 boxes?) = ¾
Notice that we are not using these images to solve one solitary problem. We are studying contexts to understand the relationship between the quantities shown.
Game: break it up
30

Pick one number to decompose in different ways according to the rules, which focus on number relationships.
In A, the 3 equal lines prep our brain for looking for three equal amounts. Support this game with cubes, working with a partner, or using a game frame (like the visual in C) on a dry-erase board.
This is excellent prep for conceptual understanding of division or fractional amounts, such as 2/3 in C seen as 2 one-third amounts.
On another day, Add One Thing by showing students these numbers as they work with a related number, like 60.
TOOL USE
Base 10 Blocks: Through the Grades
-
Tools allow action of the associative property to be seen and felt.
14 + 14 + 14 + 14
(10+10+10+10) + (4 + 4 + 4 + 4)
28 + 28
-
4 x 14 = 4(10) + 4(4) = 40 +16 = 56
-
Model the distributive property
4 x 1.4 = 4(1) + 4(.4) = 4 + 1.6 = 5.6
Or, use place value understanding!
4 x 1.4 = 1/10 (4 x 14)

100 Chart: One example of using a 100 chart through the years
-
What number are we counting by? Describe the patterns you see.
What number would come next after 100?
How would a 200 chart look if the pattern continued?
-
What do you notice about the number in the ones place of the yellow highlighted numbers?
Why do you think this pattern occurs?
Do you think that this pattern would continue on any 100s chart, such as 300? How does your brain see it?
-
How many numbers on this 100 chart are highlighted? What fraction is that of the whole chart?
How many numbers are blue? What fraction is that?
Do you expect 4 to be a factor of 200 (two one-hundreds) as well? How are you thinking about it?
How many numbers would be highlighted on a 200 chart?
Add One Thing: if we circled all the multiples of 2 on this chart, how many circled numbers would there be?
How many numbers would be yellow and have a circle?
What about the multiples of 8?


Cubes on a number line: Use cubes with measured number lines that connect physical quantity to the linear number line
-
Earlier, we saw that two of our 6-cube towers landed on the number 12 on the number line. If we broke those towers in half, how many cubes would be in each part?
How many of those parts would there be?
-
We see here that four groups of 3 land on 12. What other equal groups will land on 12? Let’s chart our findings and discuss how these numbers relate to each other.
-
How much is one fourth of 12? 2/4? ¾? 4/4? Can you show us with the cubes or the number line?
Can we show these groups off the number line as an array?
How do factors connect to area and dimensions?

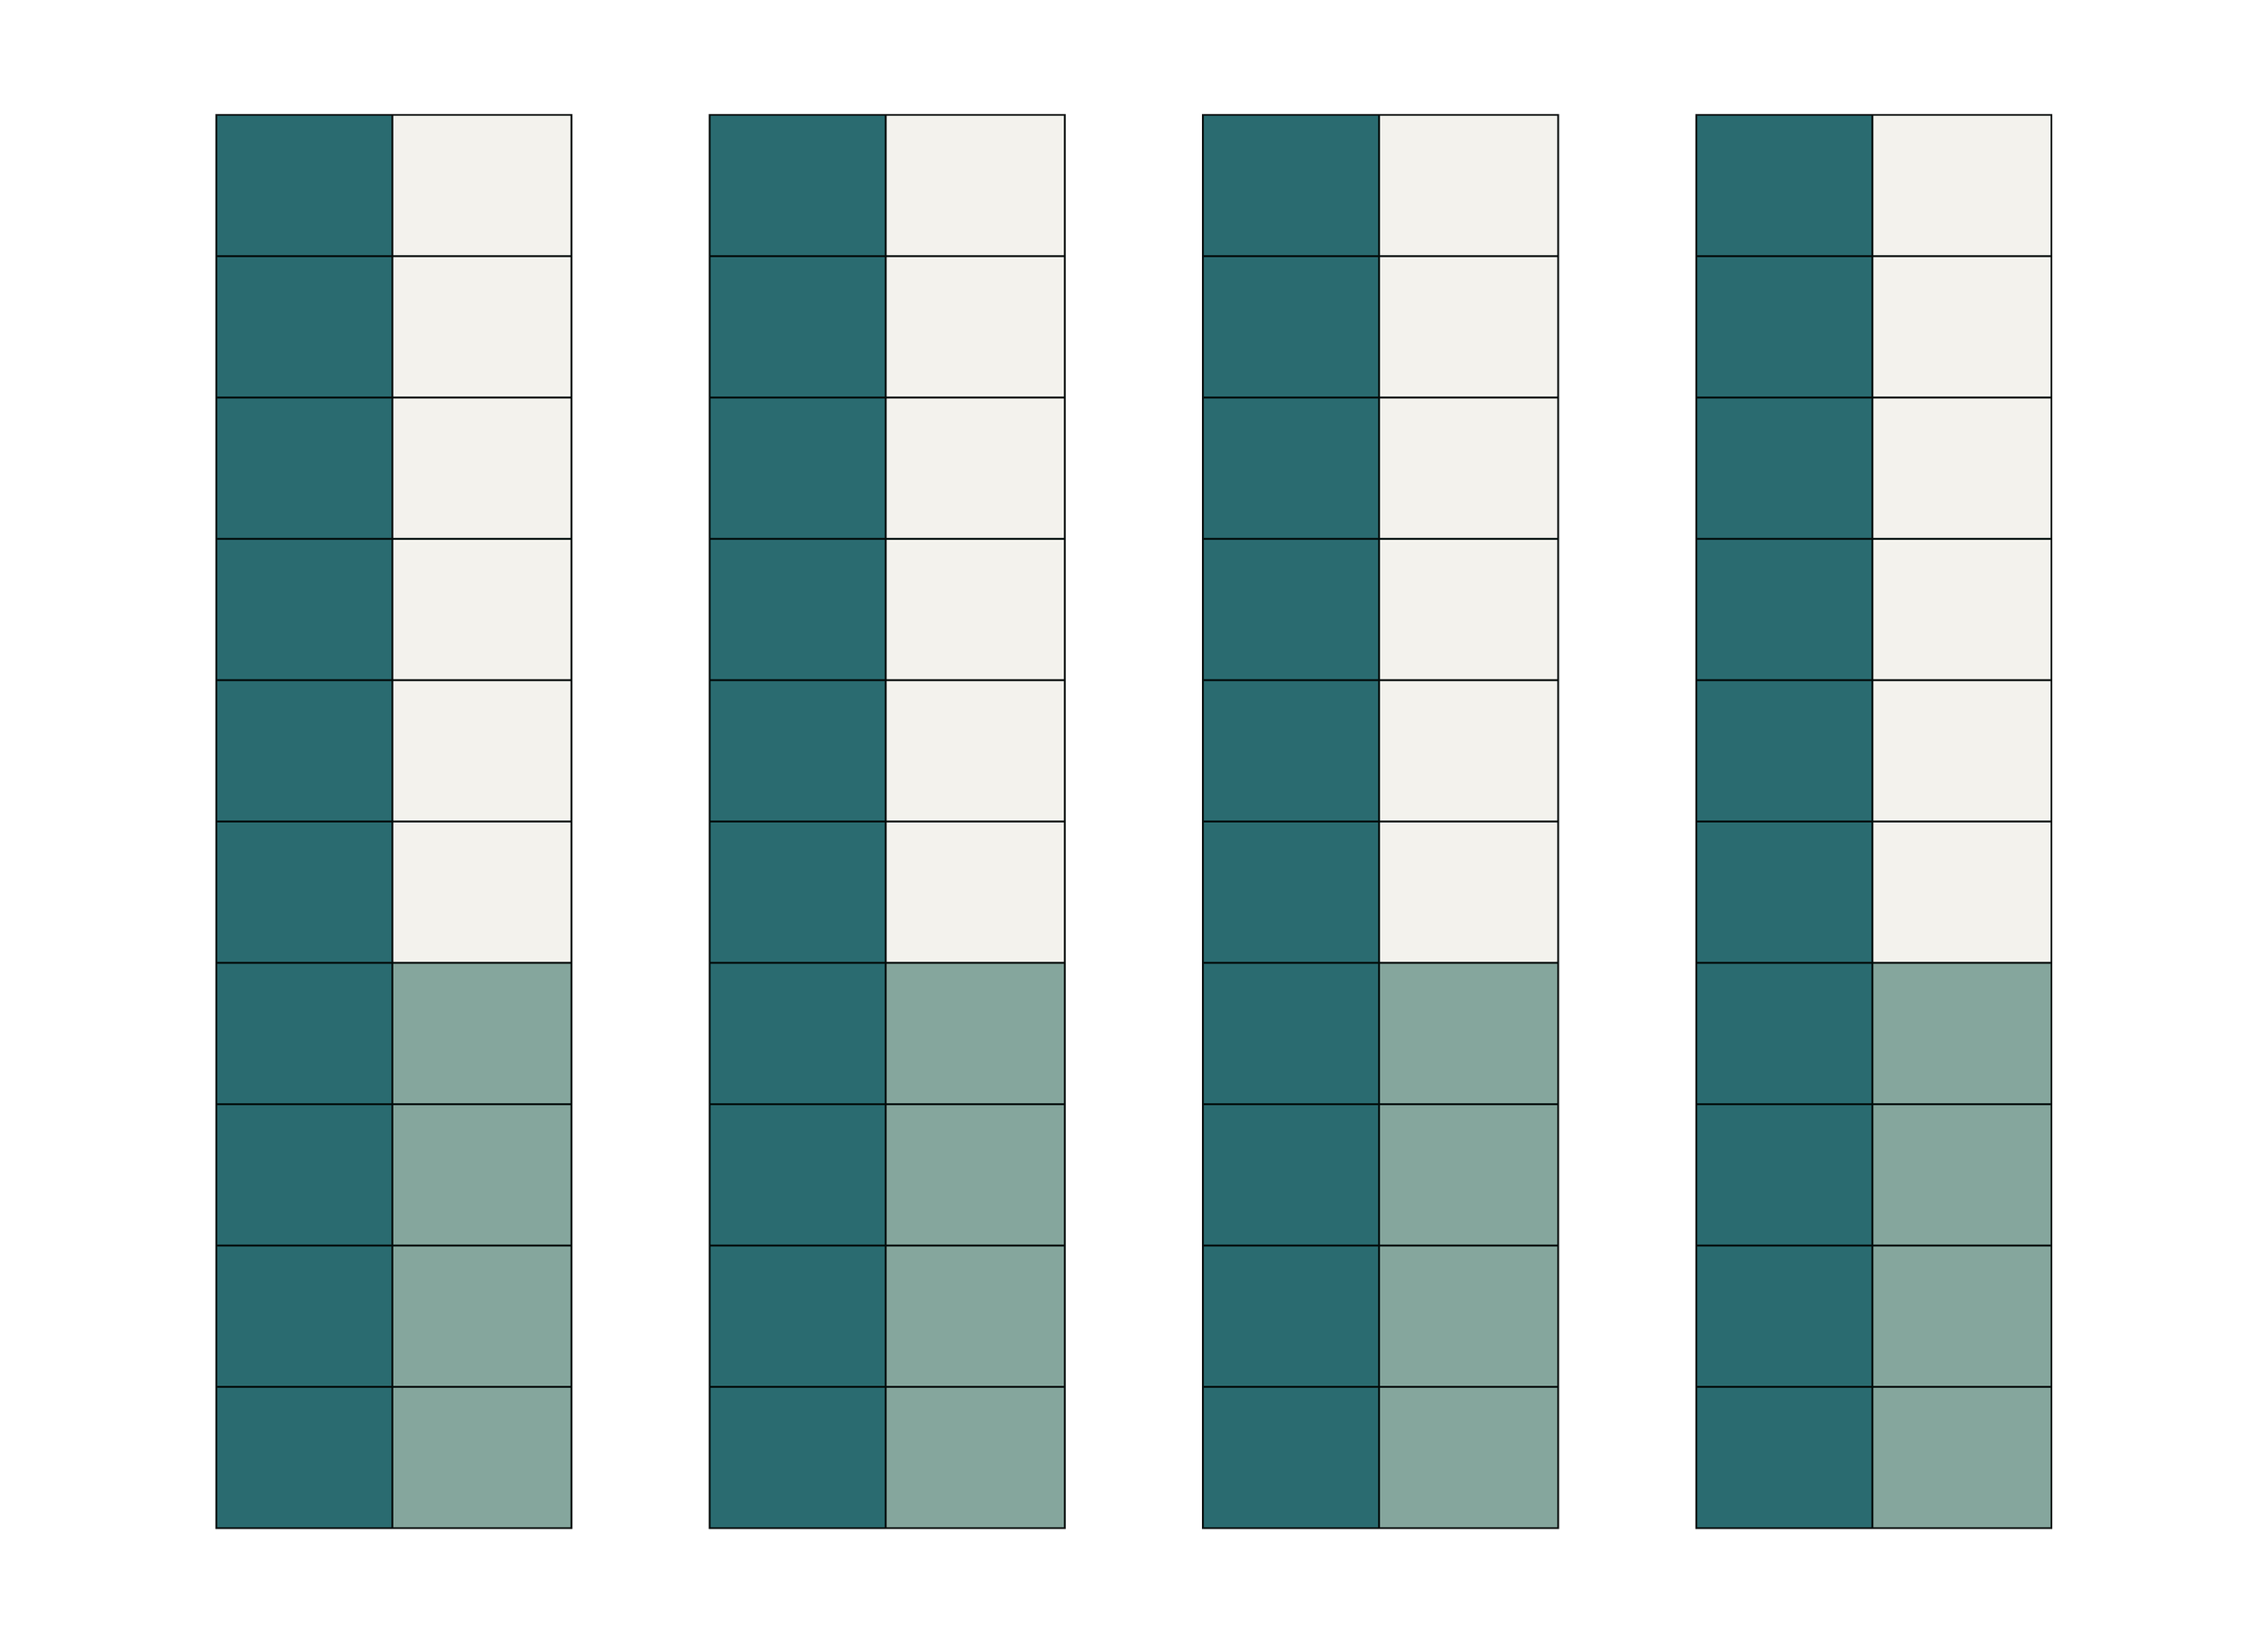
Bar models through the years
Size model: Each horizontal bar represents the same total quantity, broken up into equal amounts.
Before we put specific numbers in, let’s explore the number relationships first.
These visuals become mental models that allow students to think structurally about any specific numbers.

Understand the relationship between the cells in A to the cells in B.
Examples students may say:
2B = 1A
A/2 = B
B is half as large as A
A is double B
It takes 2 Bs to = 1 A
Also understand the relationship between A and C.
Recognize the parallel relationship that exists between A and B also exists between B and C.
Once the relationship is understood, specific numbers can be added to the structure that are right for the student and the concept being explored.